ESG Suite module

Carbon Footprint & Utilities Optimisation

The software to calculate your corporate carbon footprint across Scope 1, 2 and 3 and monitor energy consumption and utilities in real time. Downloadable report in one click.

Carbon Footprint iconCarbon Footprint & Utilities OptimisationESG Suite module

CO₂ equivalent emissions

What are Scope 1, 2 and 3 emissions

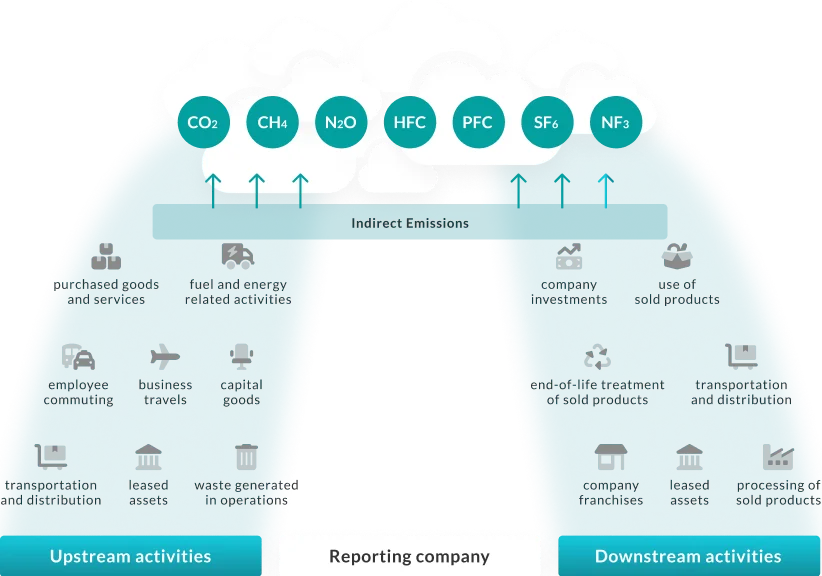
Understanding how greenhouse gas emissions contribute to a company's carbon footprint is the first step towards effective decarbonisation. The GHG Protocol divides them into three scopes: Scope 1, 2 and 3. Green Future Project's software calculates every category, distinguishing sources, emission factors and reporting boundary.

What does the carbon footprint measure?

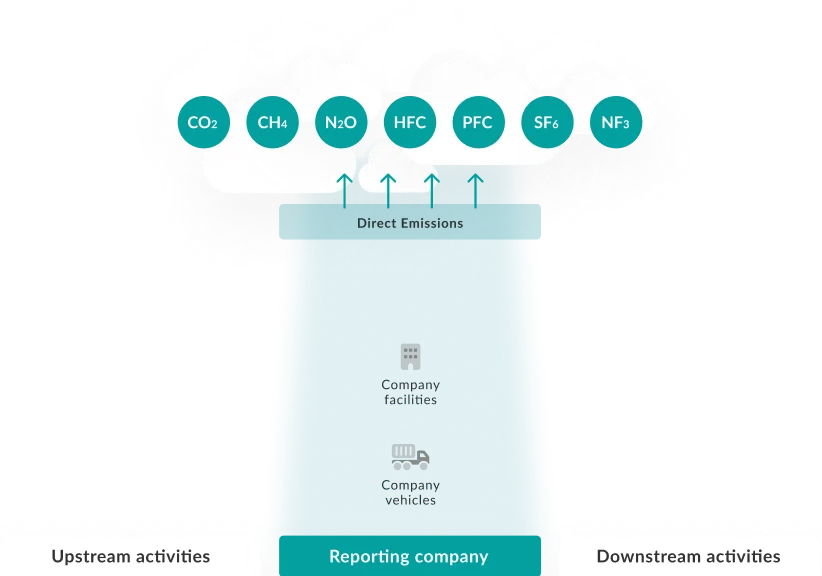
  • Scope 1direct emissions from sources owned or controlled by the company
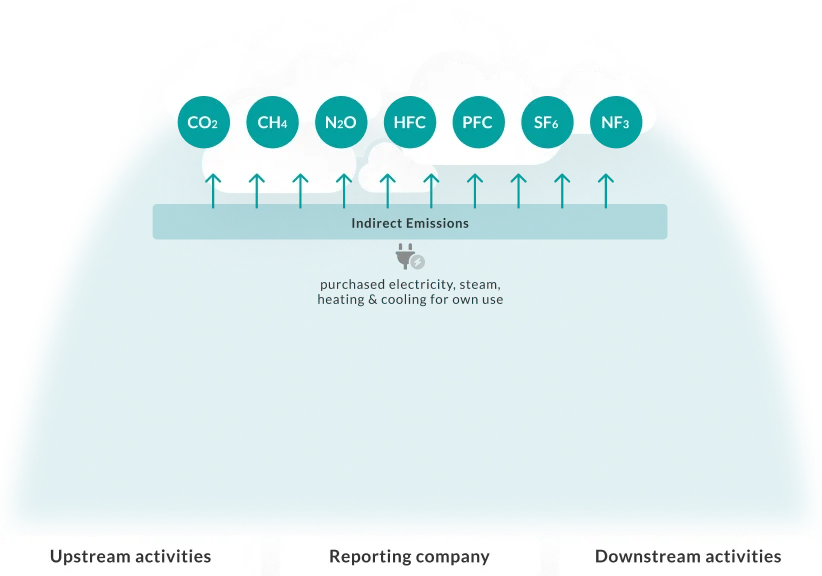
  • Scope 2indirect emissions from purchased energy
  • Scope 3indirect emissions across the value chain
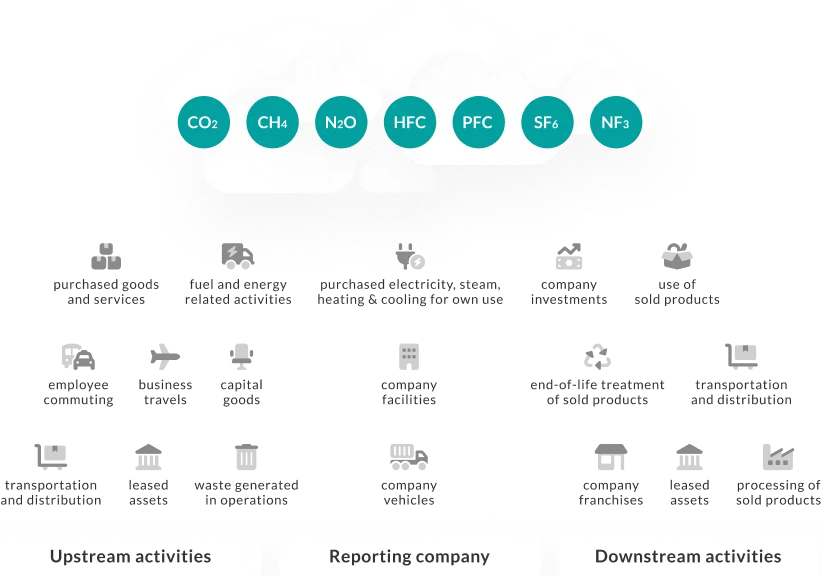
Greenhouse gas emissions infographic: upstream activities, reporting company and downstream activities

Verified methodology

Calculation compliant with international standards

The platform calculates CO₂e emissions in line with the main reference protocols and standards:

GHG Protocol

Voluntary international standard for the accounting and reporting of greenhouse gas emissions

ISO 14064-1: 2018

International standard for the quantification and reporting of CO₂e emissions at organisation level, validated by an accredited third-party body

Validation opinion IT339852-1GHG Protocol Corporate Standard
Bureau Veritas

The carbon footprint calculation can be verified by an independent third party, guaranteeing reliable and compliant data: every value can be traced back to its source data and the emission factor applied, ready for verification and for inclusion in the sustainability report.

Carbon Footprint module

Calculate your carbon footprint automatically

Company data is uploaded just once: the software applies up-to-date emission factors and returns the complete carbon footprint, ready to share.
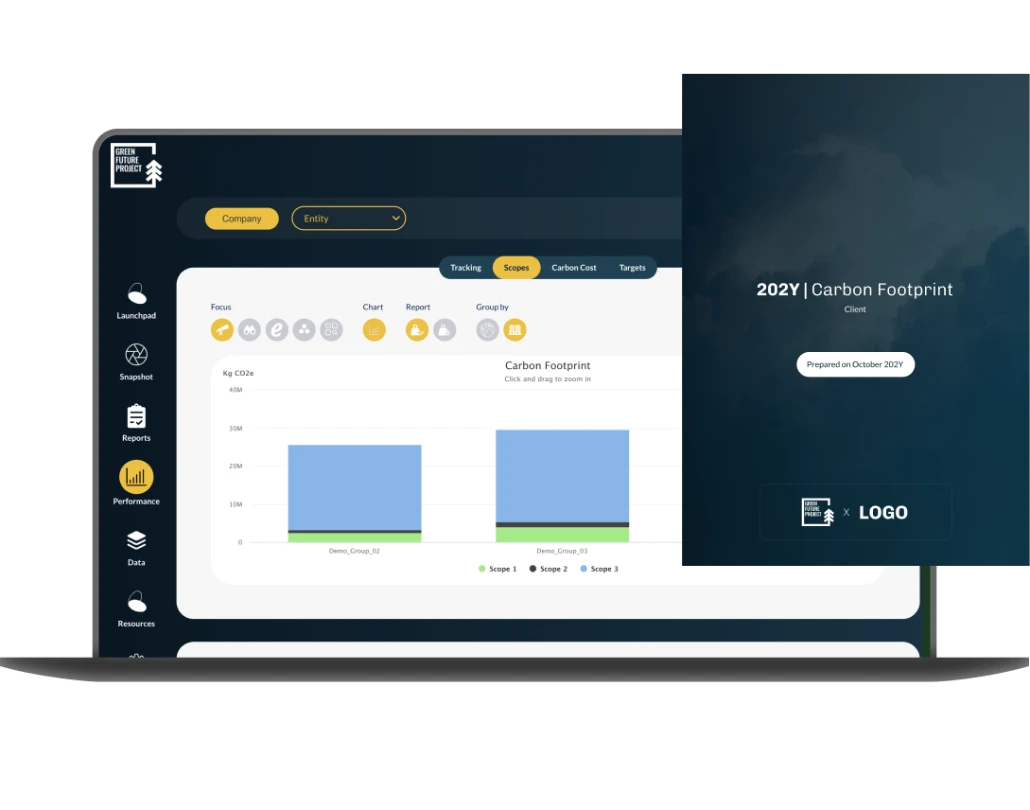
  • Calculation for all Scope 1, 2 and 3 emissions
  • Compliance with the GHG Protocol and ISO 14064-1
  • Reliable, traceable data
  • Carbon Footprint Report downloadable in one click

Utilities Optimisation module

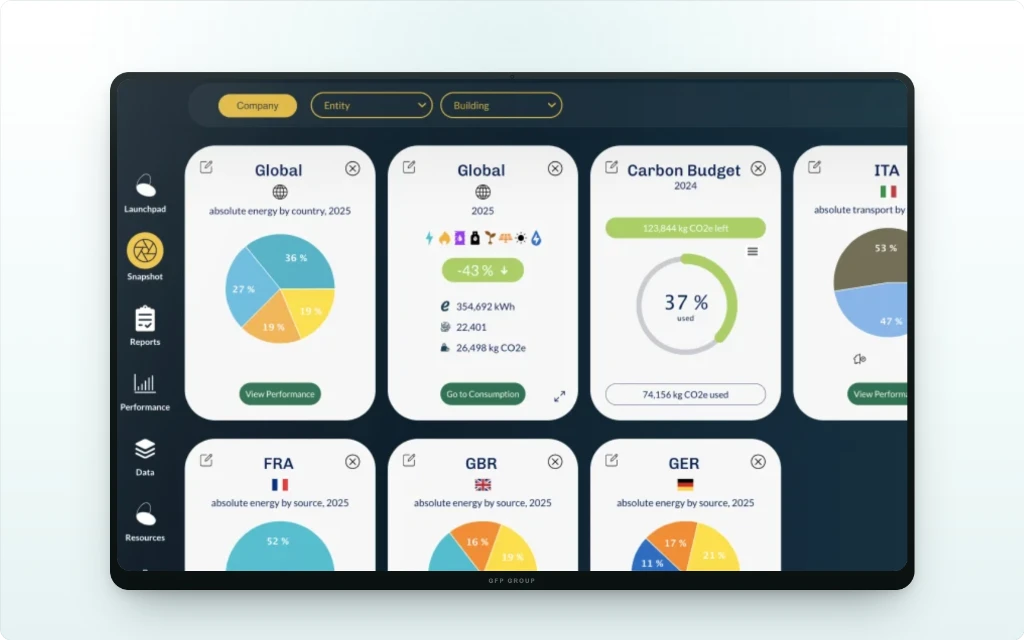
Monitor energy consumption in real time

All your company's utilities in a single interface: electricity, gas, water and heat, aggregated by site or analysed individually.
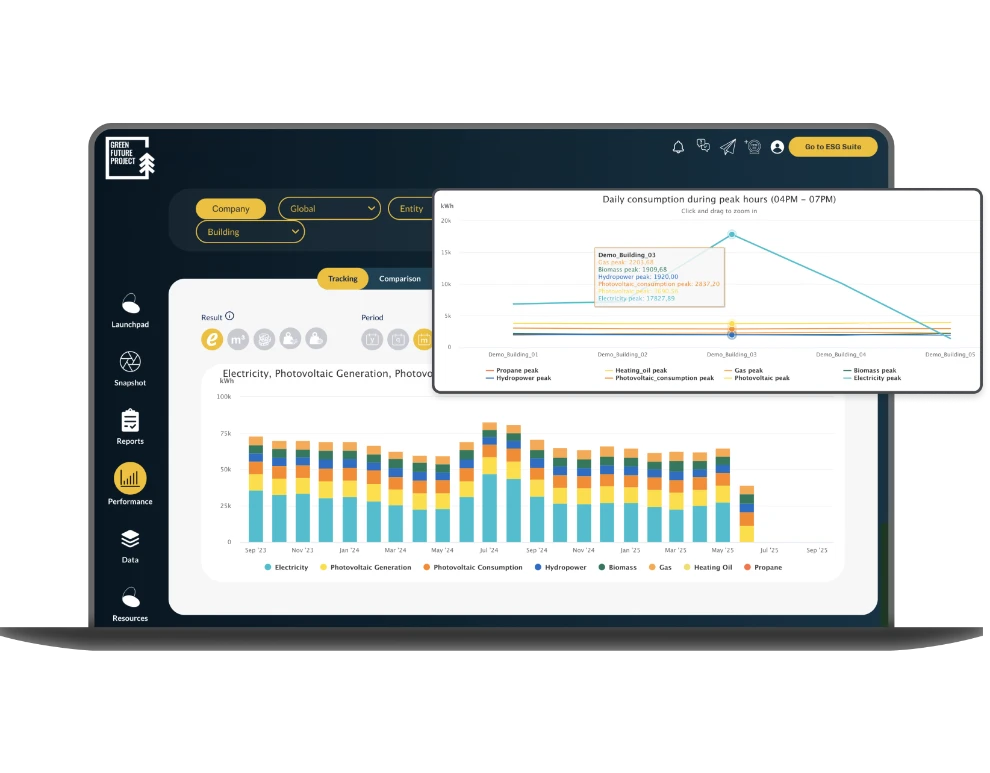
  • Detailed monitoring of all utilities
  • Analysis by source, time slot and period
  • Identification of peaks and inefficiencies
  • Data-driven efficiency strategies

Case studies

Companies measuring emissions and monitoring consumption

The companies that chose the software to calculate Scope 1, 2 and 3 emissions and make their energy consumption more efficient.

Kerakoll headquarters, a circular building with solar panels

KERAKOLL

Kerakoll independently uses the Carbon Footprint module to measure its emissions and define decarbonisation strategies.

LUSH cosmetic products

LUSH

LUSH monitors the energy consumption of all its UK stores through a single platform.

Historic façade of the Banco BPM headquarters

BANCO BPM

Banco BPM uses the Carbon Footprint module to calculate the emissions of its Italian sites and track their progress against the baseline.

Acetum technicians at work among balsamic vinegar barrels

ACETUM

Acetum independently uses the Carbon Footprint and Utilities Optimisation modules to measure emissions and optimise energy consumption.
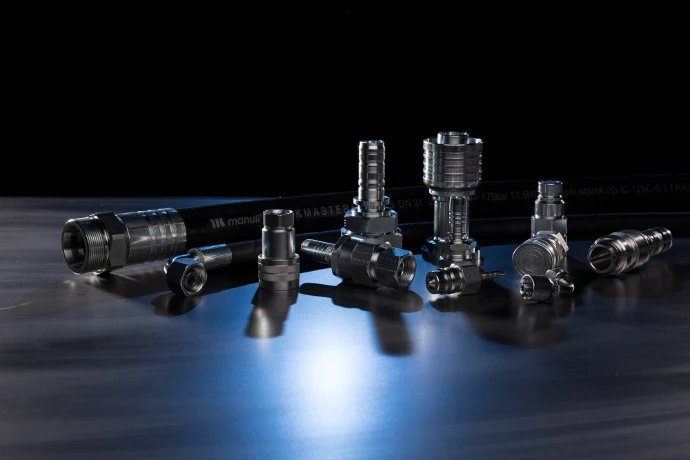
Manuli Ryco hydraulic fittings

MANULI RYCO

Manuli uses the Carbon Footprint module to calculate its Scope 1, 2 and 3 emissions globally.

FAQ

Frequently asked questions

Answers to the most common questions about the Carbon Footprint & Utilities Optimisation Software.

Scope

Scope 1, 2 and 3 emissions are the three categories into which the GHG Protocol divides a company's emissions: Scope 1 covers direct emissions (e.g. company fleet, plants); Scope 2 covers indirect emissions from purchased energy (electricity, heating); Scope 3 covers all other indirect emissions across the value chain, upstream and downstream (suppliers, transport, use and end of life of products). Green Future Project's Carbon Footprint Software automatically maps company data onto all three scopes.
Scope 3 emissions are the hardest to measure because they cover 15 categories defined by the GHG Protocol, spread across the entire value chain. Scope 3 often accounts for more than 70% of a company's total emissions and requires data from external parties (suppliers, employees, customers) rather than from internal sources as for Scope 1 and 2. Green Future Project's software tackles this complexity by organising data into six simplified thematic areas: Energy, Transport, Water, Waste, Procurement and Other. The Carbon Footprint Software then maps these areas automatically onto the 15 categories.

The 15 Scope 3 categories defined by the GHG Protocol fall into two groups; see the complete tables below:

Upstream · 8 categories

  1. purchased goods and services
  2. capital goods
  3. fuel- and energy-related activities not included in Scope 1-2
  4. upstream transportation and distribution
  5. waste generated in operations
  6. business travel
  7. employee commuting
  8. upstream leased assets

Downstream · 7 categories

  1. downstream transportation and distribution
  2. processing of sold products
  3. use of sold products
  4. end-of-life treatment of sold products
  5. downstream leased assets
  6. franchises
  7. investments

With Green Future Project's Carbon Footprint Software there is no need to handle this classification manually: the platform applies it automatically.

Methodologies

The location-based method uses the average emission factor of the national electricity grid, while the market-based method uses the emission factors specific to the energy contract in place (e.g. certified renewable energy). Green Future Project's Carbon Footprint Software calculates and compares both values, as required by all reporting standards.
There are four methodologies for calculating Scope 3: spend-based (an estimate based on expenditure, the fastest), average-data (activity data with sector-average factors), supplier-specific (data provided directly by suppliers, the most accurate) and hybrid (a combination of the above depending on the data available). Green Future Project's Carbon Footprint Software covers all four methodologies in the same tool, so you can start with the data you already have and refine the calculation in the following years.
If you don't know where to start calculating your suppliers' emissions, the method to begin with is spend-based: applying an economic emission factor to the spend for each purchase category quickly gives you a first complete picture of Scope 3 emissions, to be refined in the following years with average-data or supplier-specific data. In the Procurement section of Green Future Project's software this step is guided and does not require primary supplier data from the outset.

Software

Corporate carbon footprint software is a digital tool that automates the calculation of a company's greenhouse gas emissions according to the GHG Protocol, covering Scope 1, 2 and 3, or in line with ISO 14064-1. One example of carbon footprint software is Green Future Project's Carbon Footprint Software: it automatically applies up-to-date emission factors, organises data by area or Scope and generates reports for sustainability reporting (CSRD, VSME, GRI), avoiding manual work on spreadsheets.
Green Future Project's software is also suitable for companies with multiple sites, because it lets you create multiple organisational entities (buildings, sites, divisions), calculate the carbon footprint both for a single legal entity or subsidiary and at consolidated group level, and directly compare performance across sites, all within the same platform.
Effective energy management software for reducing the carbon footprint combines two functions that often remain separate: monitoring energy consumption and calculating greenhouse gas emissions. Green Future Project's Carbon Footprint & Utilities Optimisation Software integrates them in a single platform. It tracks electricity and gas consumption in real time, including for companies with multiple sites, and converts it into CO₂e emissions according to the GHG Protocol. Data is collected via an API connection to the energy provider or to the BMS or EMS systems already in place. The calculation methodology of the Carbon Footprint module has received validation opinion IT339852-1 from Bureau Veritas under the GHG Protocol Corporate Standard.
To reduce the carbon footprint you first need to know where and when resources are consumed. GFP's platform analyses consumption by energy source, time slot and period, and identifies peaks, inefficiencies and opportunities for improvement in the use of energy, water and other utilities. Benchmarking across sites, suppliers or periods and customisable dashboards help set concrete reduction targets and track progress over time. In this way the software supports efficiency strategies that can also cut operating costs.
Product carbon footprint requires a different approach from organisational carbon footprint. It is based on life cycle assessment (LCA) and on data specific to each product, from raw materials to end of life. GFP's software measures the organisation's carbon footprint: direct emissions (Scope 1), indirect emissions from purchased energy (Scope 2) and, where relevant, value chain emissions (Scope 3). It is therefore the starting point for understanding which emission sources weigh the most. For the carbon footprint of individual products, GFP supports companies with its LCA and EPD consulting services.

Report

If you need to recalculate your organisation's carbon footprint, the Duplicate function of Green Future Project's Carbon Footprint Software lets you start from the previous year's footprint: you update the reporting year and change only the values that have changed, with visual cues distinguishing data already updated from data still to be checked.
The time needed to calculate Scope 3 in the first reporting year depends on the calculation method adopted. A first inventory based on the spend-based method can be completed in a few weeks with Green Future Project's Carbon Footprint Software; moving towards average-data or supplier-specific data is a journey built over the following years, category by category.
Didn't find what you were looking for?Write to us

Let's talk

Book a free introductory call

Tell us about your company and your sustainability goals: one of our ESG experts will get back to you to identify the best starting point, with no commitment.

  • A 30-minute call with an expert, no commitment
  • We get back to you within 24 working hours
  • A first concrete direction for your ESG goals
This field is required.
Please enter a valid email.
This field is required.

No spam. Your data is processed in accordance with the GDPR.

Thank you, we will be in touch

We have received your request. An ESG expert from Green Future Project Group will contact you within 24 working hours.